
Development Decision Reports

Reports that admit what they don't know

Six reports covering one decision chain — what to build, whether it's approvable, how many, how long, and whether it pays. Every figure carries its source and its sample size; anything unverified says so.

How we report

Four rules every report is held to

  1. No invented thresholds

    If a planning minimum has not been verified for your site, the report says “unverified” — it never borrows a common value and passes it off as yours.

  2. Three-state compliance

    Compliant, non-compliant, or unverified. Nothing uncertain is ever displayed as a pass.

  3. No auto-ranking

    Options sit side by side. The final call is made by a named professional, not an algorithm.

  4. Sample sizes travel

    Every statistic carries its n. A conclusion drawn from 3 cases is never dressed up to look like one from 30.

A report that admits its boundaries is the one you can take to a bank or a partner.

The decision chain

Not six templates. One chain.

The land division report's dwelling count and building envelopes flow straight into the financial model; the approval-timeline evidence sets the holding-cost clock. Nothing is re-typed, so “planning says three, finance says four” cannot happen.

  1. What to sell

    • Essential land & build market analysis
    • Design premium evidence report

    ↓ Feeds the investment model

  2. Can it be approved

    • Planning feasibility analysis
  3. How many

    • Land division feasibility

    ↓ Feeds the investment model

  4. How long

    • Approval timeline assessment

    ↓ Feeds the investment model

  5. Does it pay

    • Investment return analysis

Six reports, one decision chain

Each report answers one question in the order a project should ask it, and each one's output feeds the next. Buy one, or follow the chain — every report is scoped to your site, and we confirm scope and fees with you before anything starts.

01Planning feasibility — approvable

Planning feasibility analysis

Can this site be developed, and where will it get stuck?

How it is produced

We translate every overlay on your site into its practical consequences — which referral agency, which report, whether it pushes you off the Deemed-to-Satisfy pathway, whether it triggers public notification.

What's Included

  • Zone & overlay consequence analysis, item by item
  • Assessment pathway & notification category derivation
  • Referral agencies & document checklist
  • Site evidence register (photos, categories, dates)
  • Development prompts: opportunities, constraints, actions, assumptions

What it will not claim

Overlays outside our verified catalogue are marked “not derived” — we never invent an interpretation.
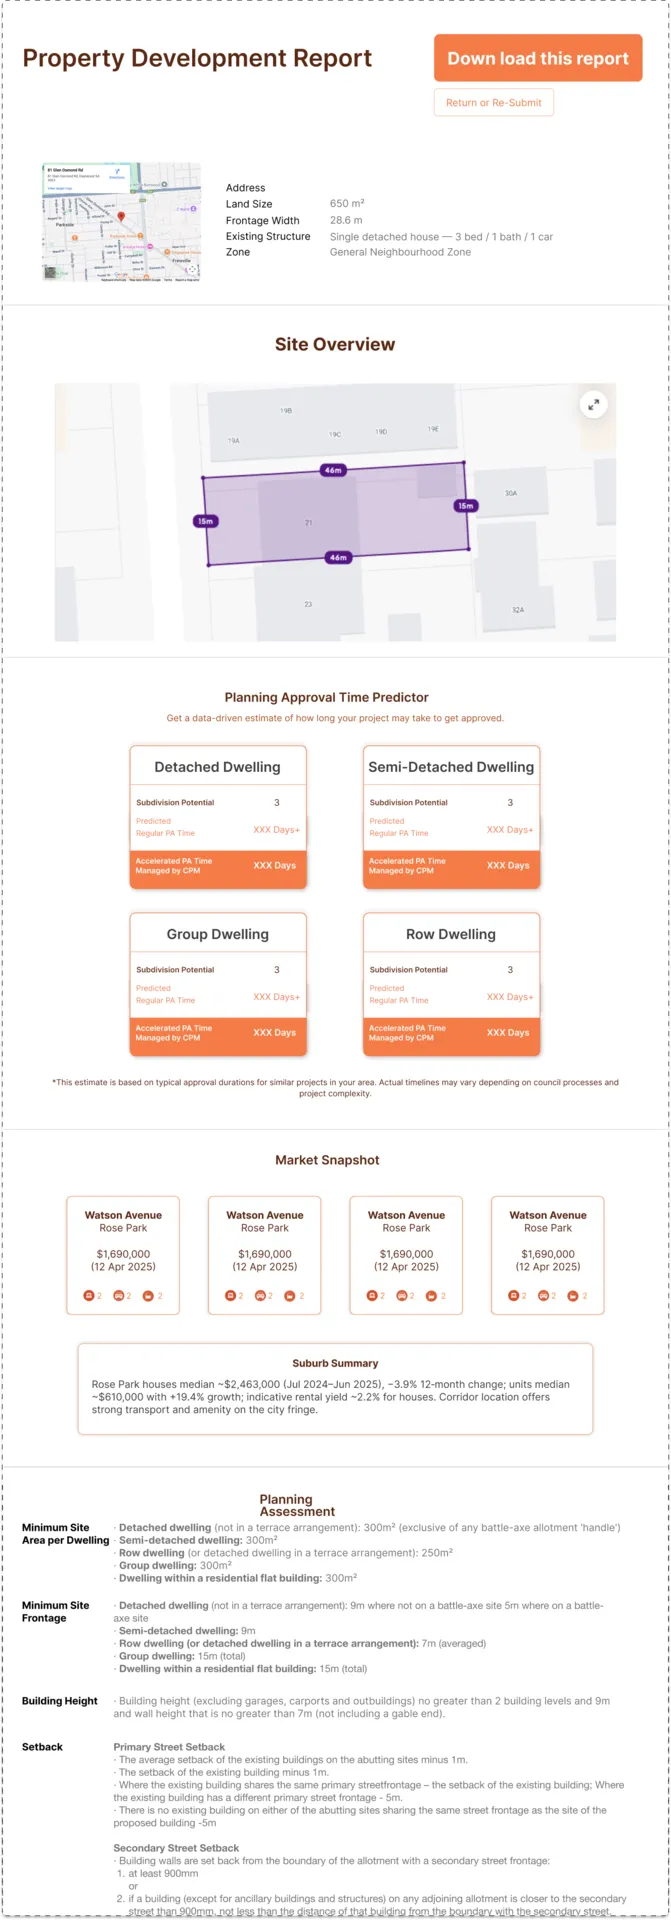

Sample page from the Planning feasibility analysis
Sample page from this report
What's in this report
02Land division — buildable

Land division feasibility

How many allotments, how big, and what can be built on each?

How it is produced

“How many blocks” is governed by three constraints at once — minimum area, minimum frontage, setbacks. We screen capacity against all three, generate concept division plans with building envelopes, and run a frontage reality check on every option.

What's Included

  • Capacity screening across standard & affordable housing mixes
  • Concept division plans (allotments, building envelopes, setbacks)
  • Five-band compliance marking, including “unverified”
  • Frontage reality check & driveway configuration flags
  • Party-wall envelope treatment for attached forms

What it will not claim

Concept schemes only — subject to planning consent. Without verified minimums from you, results are marked “unverified”, not assumed.

Sample page from the Land division feasibility
Sample page from this report
What's in this report
Market evidence — what to sell

Essential land & build market analysis

In this area, what size land and home does the market actually pay for?

How it is produced

Average prices you can look up yourself. What we model is marginal value — how much more the market pays per extra unit of land or building area, and in which range that relationship is most reliable — from cleaned sales evidence with transparent outlier handling.

What's Included

  • Sales-evidence cleaning & outlier treatment notes
  • Regression across land size, building area & price, with reliability ranges
  • 3D market distribution visualisation
  • Bedroom, bathroom & parking mix against price
  • Market value indicators per product configuration

What it will not claim

Analysis of settled sales — a market value indicator, not a valuation, and not a price forecast.

What's in this report
Market evidence — what standard to set

Design premium evidence report

Which design choices does the top of the market consistently pay for?

How it is produced

We rank nearby sales by price per square metre of building, take the top and bottom thirds, and survey each home against 37 design elements — street presence, volume, plan function, landscape, finish. The output is two lists: the common recipe of the high group, the common gaps of the low group.

What's Included

  • High-versus-low group comparison across 37 design elements
  • Per-property survey records, photo-evidenced
  • The high group’s common recipe
  • The low group’s common gaps
  • Custom elements analysed on equal footing

What it will not claim

Correlation, not causation — and an element common among high-priced homes is not proof it earns back its build cost. Both boundaries are stated in the report.

What's in this report
Timeline evidence — how long

Approval timeline assessment

How long will approval actually take — and what makes it longer?

How it is produced

We match your application’s profile against our own delivered-case library and the published research we co-authored on 20,000+ South Australian planning applications. You get ranges, never a single number — and the match criteria are widened step by step, with every widening disclosed.

What's Included

  • Historical duration ranges matched to your profile (quartiles + median)
  • Transparent match-widening trail
  • RFI and no-RFI scenarios reported separately
  • Time increments per application element (referrals, notification, demolition)
  • Refusals & withdrawals reported separately from durations

What it will not claim

An evidence-based assessment from historical cases — not a guarantee of any approval or timeframe.

What's in this report
03Project feasibility — bankable

Investment return analysis

How does the money move, and is the project worth doing?

How it is produced

A full development financial model built line by line — every cost item reviewed and re-derived by an analyst rather than accepted from a template, including the auto-generated ones. Its inputs are not guesses: dwelling counts come from the land division report, prices from market analysis, timing from approval evidence.

What's Included

  • Full cost breakdown, every line with its source and assumption stated
  • S-curve construction cash flow, equity and debt separated
  • Peak funding requirement & interest capitalisation
  • Multi-scenario price sensitivity
  • Side-by-side option comparison

What it will not claim

Options are compared, never auto-ranked. The recommendation is signed by a professional, and every assumption in the model stays visible to you.

Sample page from the Investment return analysis
Sample page from this report
What's in this report

Where to start

Pick by your situation, not by report name

  • Looking at a site

    Know what it can do before you buy — the wrong site is the most expensive mistake.

    • Planning feasibility analysis
    • Land division feasibility
    Read more for your situation
  • Already own land

    What is the optimal scale here, and is it worth moving on.

    • Land division feasibility
    • Investment return analysis
    Read more for your situation
  • About to commit

    Is the approval duration in your financial model a guess, or an estimate?

    • Approval timeline assessment
    • Investment return analysis
    Read more for your situation
  • Deciding the spec level

    Will the market hand that extra spend back to you.

    • Design premium evidence report
    • Essential land & build market analysis
    Read more for your situation

Before you enquire

Questions we get asked

Public data, certainly. That is why school zones and population statistics — the things portals give away — are deliberately left out. The reports carry only analysis that requires professional judgement: what an overlay means for your application, how many allotments a site genuinely yields, and where the experience range for approval durations sits.
Where a report says “unverified”, that is the truth of the matter. Better to show you exactly where homework remains than to hand you a tidy number that will not survive scrutiny. A report that admits its boundaries is the one worth taking to a bank or a partner.
No. The reports provide market value indicators and strategic estimates based on settled sales. They are not a valuation and they do not forecast prices.
No. Planning and division findings are professional assessments and concept schemes under the current Planning & Design Code, subject to consent. Timeline figures are evidence-based assessments drawn from historical cases, not commitments.
They are the output of the Strategy gate in our SAFE framework. Take them standalone if you wish; if the project proceeds, their findings become the working papers for everything that follows — nothing is redone.

The Evidence Base

Our timing assumptions are not guesses

The approval durations in a CPM feasibility report are grounded in research we co-authored: an analysis of 20,000+ South Australian planning consent applications identifying which workflow triggers actually extend a timeline. The paper's own advice to developers is to price the downside rather than the median — which is how we build these reports.

20,000+

SA planning consent applications analysed

Residential subdivision consent applications lodged through PlanSA between January 2022 and June 2025.

18

Adelaide metropolitan councils covered

Proportionally sampled across all 18 metropolitan councils, so council-level variation is measurable.

6–12 mths

Typical land division, lodgement to new titles

The council decision itself takes only 30–60 business days of that; conditions, works and title clearances take the rest. Sequenced in parallel, a division lands at the short end. Range per Land Services SA and SA industry guidance.

See the findings and charts →

Source: Australian Residential Construction Institute (RESI), Australia Housing Market White Paper 2026. Chapter 2 draws on original research by Percy Zhang, Dr Ruidong Chang, Dr Joy Fang, Dr William Jiang — “Unlocking the Building Pipeline in a Housing Crisis: Data Mining South Australia’s Planning Approval Processes” — recipient of the Best Paper Award, 48th AUBEA International Conference. Used with permission.
